06. Measuring Curvature I
Measuring Curvature
You're getting very close to a final result! You have a thresholded image, where you've estimated which pixels belong to the left and right lane lines (shown in red and blue, respectively, below), and you've fit a polynomial to those pixel positions. Next we'll compute the radius of curvature of the fit.
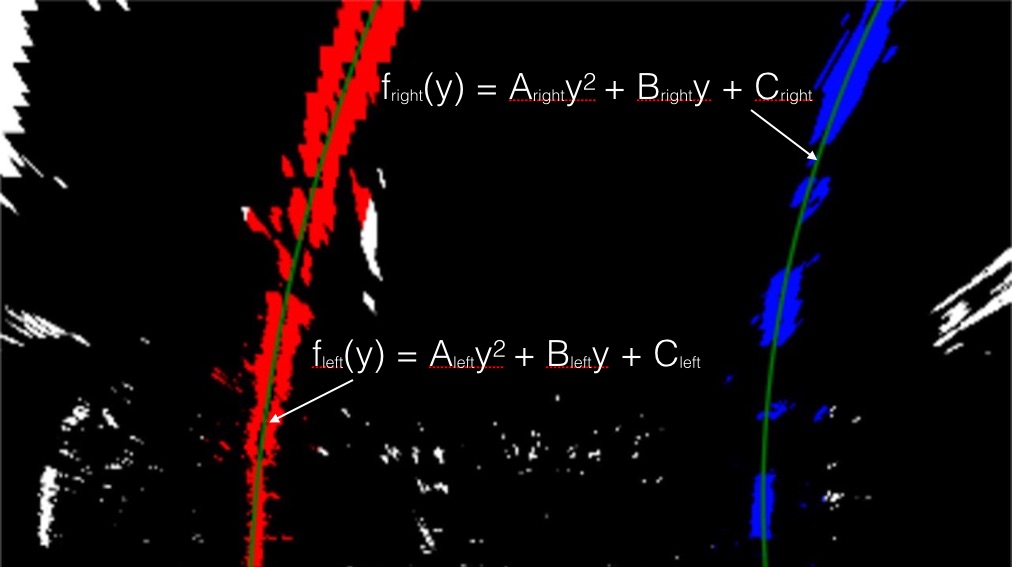
Here I have fit the left and right lines with a second order polynomial shown in green.
In the last exercise, you located the lane line pixels, used their x and y pixel positions to fit a second order polynomial curve:
f(y) = Ay^2 + By + C
You're fitting for f(y) , rather than f(x) , because the lane lines in the warped image are near vertical and may have the same x value for more than one y value.
Radius of Curvature
The radius of curvature ( awesome tutorial here ) at any point x of the function x = f(y) is given as follows:
\LARGE R_{curve} = \frac{[1 + (\frac{dx}{dy})^2]^{3/2}}{|\frac{d^2x}{dy^2}|}
In the case of the second order polynomial above, the first and second derivatives are:
\large f'(y) = \frac{dx}{dy} = 2Ay + B
\large f''(y) = \frac{d^2x}{dy^2} = 2A
So, our equation for radius of curvature becomes:
\LARGE R_{curve} = \frac{(1 + (2Ay + B)^2)^{3/2}}{\left |2A \right |}
The
y
values of your image increase from top to bottom, so if, for example, you wanted to measure the radius of curvature closest to your vehicle, you could evaluate the formula above at the
y
value corresponding to the bottom of your image, or in Python, at
yvalue = image.shape[0]
.
Implementing the Calculation
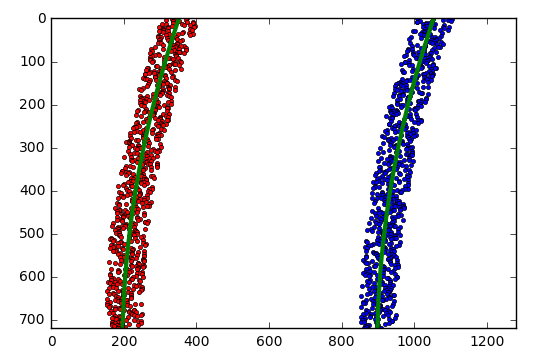
Generate some fake data first
Most of the code below is just to generate some fake data to visualize with - everything up until the actual plotting of the data below should be replaced with your algorithms from before in your own implementation!
import numpy as np
import matplotlib.pyplot as plt
# Generate some fake data to represent lane-line pixels
ploty = np.linspace(0, 719, num=720)# to cover same y-range as image
quadratic_coeff = 3e-4 # arbitrary quadratic coefficient
# For each y position generate random x position within +/-50 pix
# of the line base position in each case (x=200 for left, and x=900 for right)
leftx = np.array([200 + (y**2)*quadratic_coeff + np.random.randint(-50, high=51)
                              for y in ploty])
rightx = np.array([900 + (y**2)*quadratic_coeff + np.random.randint(-50, high=51)
                                for y in ploty])

leftx = leftx[::-1]  # Reverse to match top-to-bottom in y
rightx = rightx[::-1]  # Reverse to match top-to-bottom in y


# Fit a second order polynomial to pixel positions in each fake lane line
left_fit = np.polyfit(ploty, leftx, 2)
left_fitx = left_fit[0]*ploty**2 + left_fit[1]*ploty + left_fit[2]
right_fit = np.polyfit(ploty, rightx, 2)
right_fitx = right_fit[0]*ploty**2 + right_fit[1]*ploty + right_fit[2]

# Plot up the fake data
mark_size = 3
plt.plot(leftx, ploty, 'o', color='red', markersize=mark_size)
plt.plot(rightx, ploty, 'o', color='blue', markersize=mark_size)
plt.xlim(0, 1280)
plt.ylim(0, 720)
plt.plot(left_fitx, ploty, color='green', linewidth=3)
plt.plot(right_fitx, ploty, color='green', linewidth=3)
plt.gca().invert_yaxis() # to visualize as we do the images
The output looks like this:
Implementing the calculation itself
Now we have polynomial fits and we can calculate the radius of curvature.
In the below quiz, you'll implement the radius of curvature calculation (using our fake generated data from above - remember that you'll be using your own implemented algorithm in place of the
generate_data
function in the below quiz!).
Use the
\large R_{curve}
equation above in order to calculate
left_curverad
and
right_curverad
in the
measure_curvature_pixels()
function below.
Start Quiz: